Multi-Device Synchronized Stock Market Analysis Chart Interface
Description
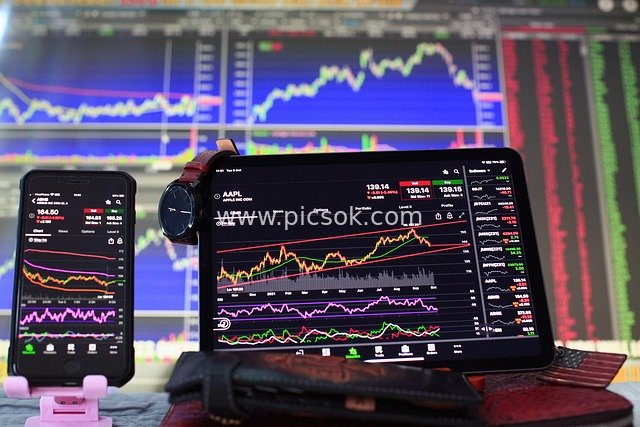
The image depicts a financial investment scene composed of electronic devices: a black smartphone rests on a pink stand on the left, while a black tablet sits on the right. Both screens synchronously display stock candlestick charts, MACD, and other technical indicator curves. The tablet clearly marks the stock price and rise/fall data for "AAPL" (Apple). The background features a colorful large financial trading screen, where blue-green trend charts interweave with red bar graphs, conveying the dynamism of market fluctuations. A black smartwatch on the wrist, a brown leather wallet below, and black items add real-life authenticity. The overall atmosphere is professional and highly technological, capturing the moment an investor monitors the stock market in real time and formulates trading strategies. The fluctuating charts metaphorize market opportunities and risks, showcasing a modern investment scenario empowered by technology.