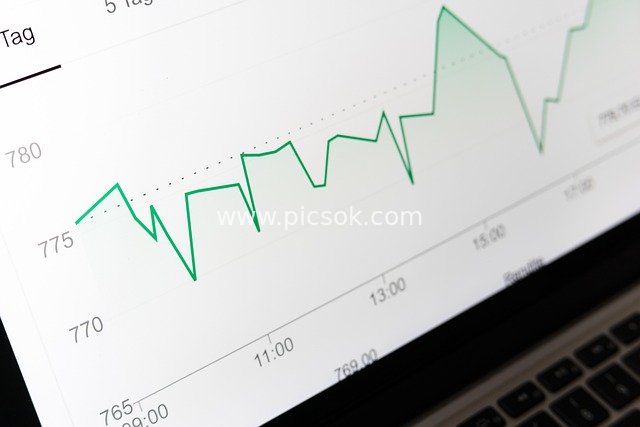
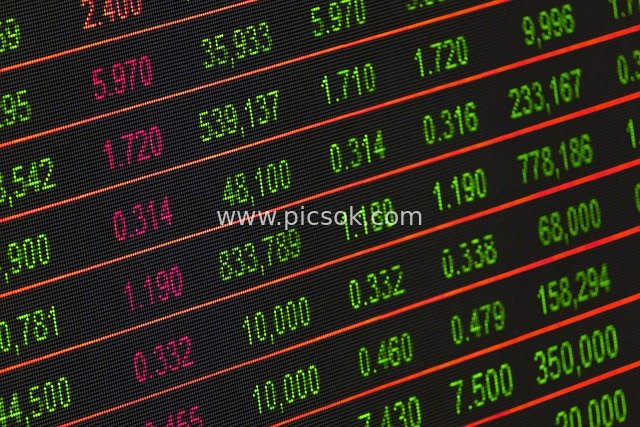
Financial Stock Market Line Chart on Computer Screen
Description
Close-up of a computer screen displaying a green financial line chart, with a timeline extending from 9:00 to 15:00 and values fluctuating between 770 and 780. The edge of a keyboard is faintly visible in the background. The overall color tone is fresh, and the composition focuses on the chart details, conveying a professional atmosphere of stock market fluctuations and financial data analysis. Suitable for scenarios such as finance, investment, and stock markets, it showcases the dynamic changes of economic indicators.
Category
Technology
License
Royalty-free stock photo
Author
viarami


